最近的项目需要对文本数据各字段进行快速检索、组合查询、模糊查询,在架构选择上选择了Elasticsearch作为支撑这些功能的存储和搜索引擎。其他的不说了,刚好我的第一台mac到了,直接搞起。
什么是ELK
日志分析平台可以有多种技术架构的选型,但经过了多年的演变,现在比较流行的应该就是ELK了。 ELK三个字母的意义如下:
- Elasticsearch
- Logstash
- Kibana
架构图下图:
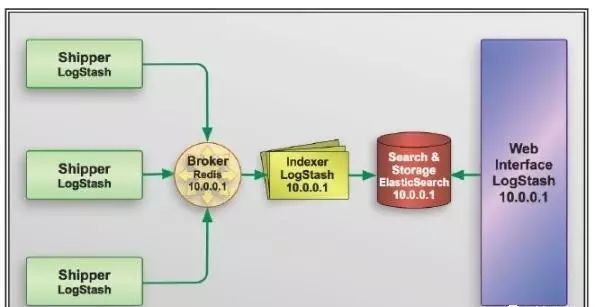
图中的Shipper和Indexer都可以是Logstash, Broker一般为Redis,也可以是kafka等。而Search & Storage则主要是Elasticsearch了,一方面接收上游index好的文档,另一方面提供API支持对内容的检索。而kibana则是一个web interface, 可以提供简单易用的界面让用户方便的写出搜索的表达式来访问Elasticsearch.
对于这三部分都有很多深入的点,以后有机会要深入学习和记录。
使用brew安装
既然使用了mac,那么使用brew安装程序则是一个最简单不过的方式了。
首先安装Elasticsearch,直接输入以下命令即可:
brew install elasticsearch
但可能遇到问题,比如要求Java的版本是1.8(我安装的Elasticsearch的按本是5.2.2),这里面可能涉及到还要安装brew cast用来安装java8, 然后又提示还有其他依赖(后悔没记录下来。。。),而需要xcode-command-tool, 折腾了不少时间。
安装完成后,可以查看elasticsearch的版本:
$ elasticsearch --version
Version: 5.2.2, Build: f9d9b74/2017-02-24T17:26:45.835Z, JVM: 1.8.0_121
启动和停止elasticsearch也很简单:
brew services start elasticsearch
brew services stop elasticsearch
浏览器访问http://localhost:9200可以看到Elasticsearch的信息:
{
name: "bWXgrRX",
cluster_name: "elasticsearch_ywheel",
cluster_uuid: "m99a1gFWQzKECuwnBfnTug",
version: {
number: "5.2.2",
build_hash: "f9d9b74",
build_date: "2017-02-24T17:26:45.835Z",
build_snapshot: false,
lucene_version: "6.4.1"
},
tagline: "You Know, for Search"
}
接着安装logstash:
brew install logstash
安装好后查看版本:
$ logstash --version
logstash 5.2.2
浏览器访问http://localhost:9600可以看到如下信息:
{
host: "ywheeldeMacBook-Pro.local",
version: "5.2.2",
http_address: "127.0.0.1:9600",
id: "70b78f4a-fe0f-4187-bf71-fe1f60b74e0a",
name: "ywheeldeMacBook-Pro.local",
build_date: "2017-02-24T17:46:55Z",
build_sha: "57984d20eb28b0df40a59077c600ec1a399d46f5",
build_snapshot: false
}
Kibana不需要通过brew安装,直接下载压缩包后,解压后执行./kibana即可。不过我还是在/usr/local/bin/下创建了kibana和kibana-plugin的软连接, elasticsearch,elasticsearch-plugin,logstash和logstash-plugin都在这个目录下,以后安装插件的话,还都需要用上这些*-plugin.
Kibana安装完成后,需要在config/kibana.yml文件中,确认elasticsearch.url: "http://localhost:9200"
测试写入和查询
写入Elasticsearch可以很简单,其本身就提供了RESTFul的API接口,参考https://www.elastic.co/guide/en/kibana/3.0/import-some-data.html ,通过以下命令创建shakespeare index:
curl -XPUT http://localhost:9200/shakespeare -d '
{
 "mappings" : {
  "_default_" : {
   "properties" : {
    "speaker" : {"type": "string", "index" : "not_analyzed" },
    "play_name" : {"type": "string", "index" : "not_analyzed" },
    "line_id" : { "type" : "integer" },
    "speech_number" : { "type" : "integer" }
   }
  }
 }
}
';
通过以下命令将数据写入Elasticsearch:
curl -XPUT localhost:9200/_bulk --data-binary @shakespeare.json
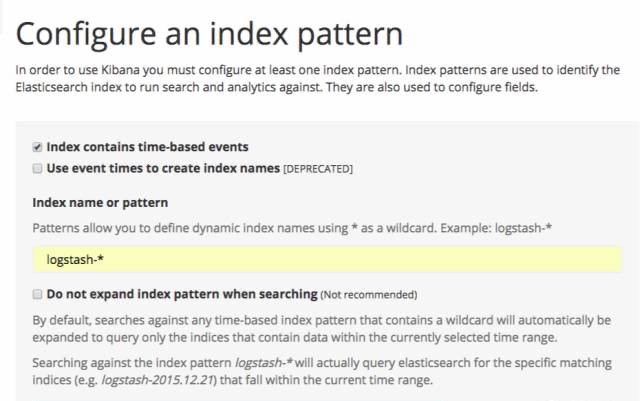
数据写入后,到kibana目录运行./kibana,启动后访问:http://localhost:5601/ , 看到kibana界面后会提示”Configure an index pattern”。, 如下图:
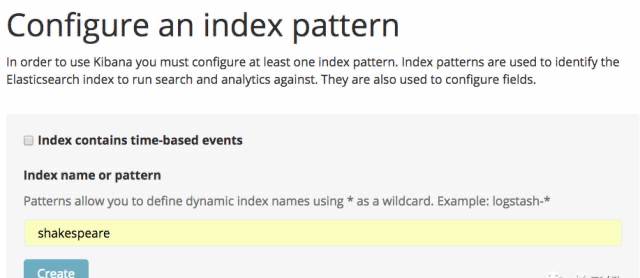
刚才在写入数据的时候已经创建了shakespeare index, 且不是按照时间分布的日志文件(shakespeare只有一个json文件),因此,取消勾选Index contains time-based envents,输入shakespeare后,就能看到create按钮了。
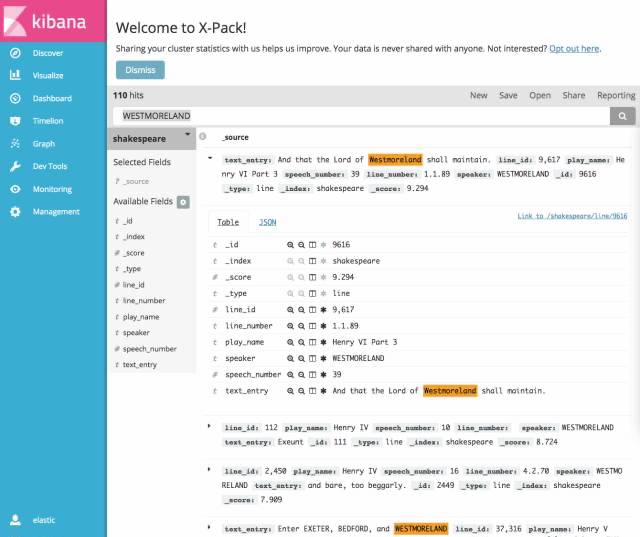
点击kibana的Discover页面,输入WESTMORELAND查询,可以看到有110个结果:
监控和安全
在Elasticsearch 5.x的时代,监控和管理由X-Pack统一完成,包含:
- 安全:用户权限管理
- 告警:自动告警
- 监控:监控Elasticsearch集群的状态
- 报告:发送报告、导出数据
- 图表:可视化数据
在安装X-Pack之前,需要停止Kibana和Elasticsearch:
elasticsearch-plugin install x-pack
kibana-plugin install x-pack
安装完成后,启动elasticsearch和kibana,访问kibana时发现需要登录了, 默认用户名和密码是elastic/changeme。

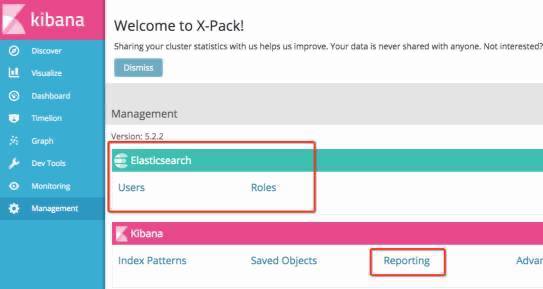
后续可以在Management面板中进行用户和角色的配置,也可以看到新增了Reporting。
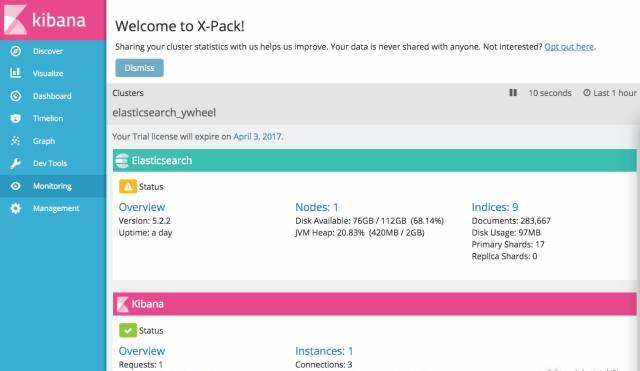
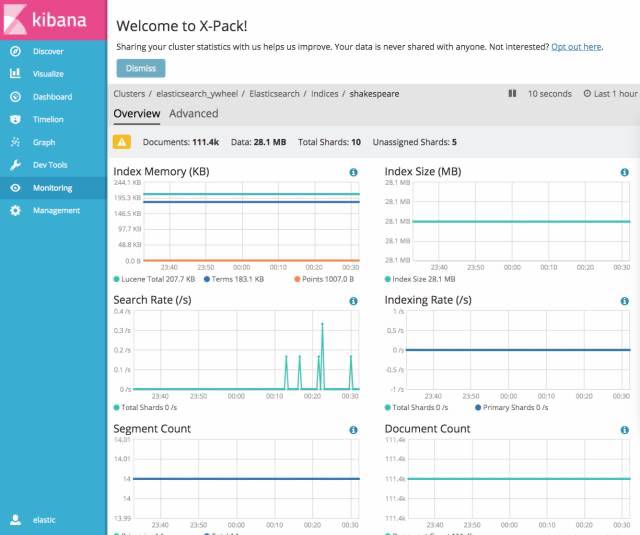
在Monitoring页面中可以看到Elasticsearch和Kibana的状态,点击Indices还可以看到具体索引的状态。
告警功能和报表功能后续再进行详细研究。之前在A家的时候,记得有个基于日志的告警功能:当service的日志中出现了ERROR或FATAL,可以自动触发告警。有了X-Pack后,这个功能应该也是可以通过ELK来实现的啦。
通过访问http://localhost:9200/_cat/indices?v查看Elasticsearch的Index, 可以发现几个新的与监控有关的index:
health status index                           uuid                   pri rep docs.count docs.deleted store.size pri.store.size
yellow open   .monitoring-es-2-2017.03.04     COZvO_dlSkqdEtntrZrzFA   1   1      10240          154      4.5mb          4.5mb
green  open   .security                       XEeHRF5NT0ud2jpxOzsoHw   1   0          1            0      2.8kb          2.8kb
yellow open   .kibana                         p-cJGBCXQySNGR0924jRdQ   1   1          2            1      9.8kb          9.8kb
yellow open   .monitoring-data-2              QZt0hpTISUO_58pWoG5Hyw   1   1          3            0      6.9kb          6.9kb
yellow open   .monitoring-kibana-2-2017.03.04 nLHKuL1KTiCE2lsWz8tdkA   1   1        849            0      245kb          245kb
yellow open   shakespeare                     zPCLp4KmTkiu7m4tYcA_Iw   5   1     111396            0     28.1mb         28.1mb
使用Logstash导入博文
在上面的操作中,直接使用了elasticsearch的API接口来进行数据的导入,而使用logstash也能够很方便的写入elasticsearch。 首先得生成一个logstash的conf文件,比如我想建立我的博客的索引,在我的家目录下创建了my_blog.conf文件:
input{
    file{
        path => ["/Users/ywheel/my_blog/content/about.md"]
    }
}
output{
    elasticsearch{
        hosts => ["localhost:9200"]
        index => "my_blog"
        user => "elastic"
        password => "changeme"
   }
}
注意拜X-Pack所赐,这配置文件里面对elasticsearch需要用户名和密码。然后敲入logstash -f my_blog.conf来执行,但却一直不成功。后来翻logstash的文档 https://www.elastic.co/guide/en/logstash/current/pipeline.html ,里面写了一句这样的话:
Inputs

You use inputs to get data into Logstash. Some of the more commonly-used inputs are:

- file: reads from a file on the filesystem, much like the UNIX command tail -0F
- syslog: listens on the well-known port 514 for syslog messages and parses according to the RFC3164 format
- redis: reads from a redis server, using both redis channels and redis lists. Redis is often used as a "broker" in a centralized Logstash installation, which queues Logstash events from remote Logstash "shippers".
- beats: processes events sent by Filebeat.
file这个input相当于使用tail来获取文件中的数据的啊, 我的about.md压根就没有变化,因此也没有内容被写入了Elasticsearch。于是,我把conf改成了这样:
input{
    file{
        path => ["/Users/ywheel/test.md"]
    }
}
output{
    elasticsearch{
        hosts => ["localhost:9200"]
        index => "my_blog"
        user => "elastic"
        password => "changeme"
   }
}
运行logstash -f my_blog_conf后,再运行cat /Users/ywheel/my_blog/content/about.md > /Users/ywheel/test.md, 然后发现数据写入了Elasticsearch, index也多了一个my_blog。到Kibana中添加my_blog这个index pattern后,就可以在Discover进行搜索了。比如我搜索“程序员”:
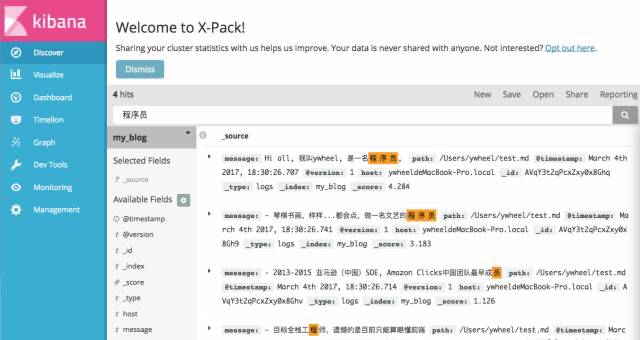
看来中文分词得改进一下,不过现在也已经很酷了! 以后可以对整个博客进行全文检索了~~

作者:ywheel
本文出处:http://blog.ywheel.com/post/2017/03/04/setup_elk_on_mac/
文章版权归本人所有,欢迎转载,但必须保留此段声明,且在文章页面明显位置给出原文连接,否则保留追究法律责任的权利。